Developing an efficient and user-friendly dashboard web application is essential in the realm of web development. It plays a vital role in providing valuable insights and improving user experience. Whether you are an experienced developer or just starting out, mastering the art of creating a dashboard web app can boost your project and simplify data visualization. NOS Digital is here to guide you through the steps of Develop Dashboard Web App, highlighting key tools, recommended practices, and effective strategies to ensure successful implementation.
What is a Dashboard Web App?
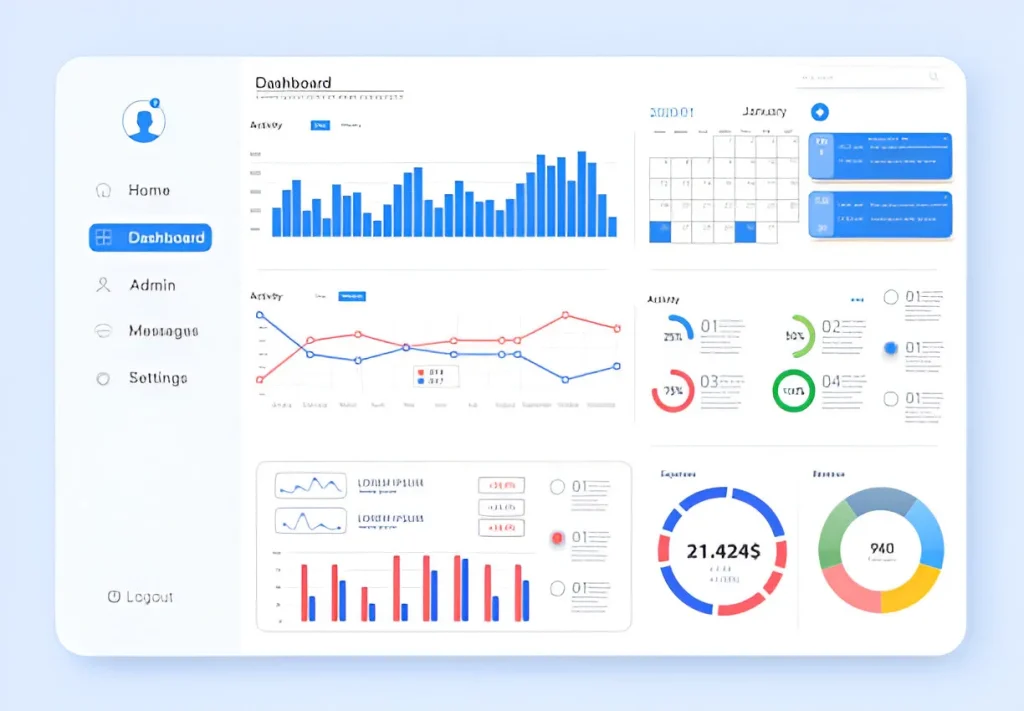
A dashboard web app is a data visualization tool designed to display key metrics and performance indicators in a user-friendly interface. These apps are commonly used in various industries, including business intelligence, project management, and analytics, to provide users with real-time insights and facilitate data-driven decision-making. By integrating various data sources, dashboard web apps present complex information in an organized and interactive manner.
Why Develop a Dashboard Web App?
Developing a dashboard web app offers several benefits:
- Enhanced Data Visualization: Dashboards allow users to visualize data through charts, graphs, and other visual elements, making it easier to interpret complex information.
- Real-Time Monitoring: Dashboards provide real-time updates and alerts, helping users stay informed about important metrics and trends.
- Improved Decision-Making: With clear and actionable insights, users can make more informed decisions and strategize effectively.
- Customizable User Experience: Dashboards can be tailored to meet the specific needs of different users or departments, offering a personalized experience.
Key Steps to Develop a Dashboard Web App
1. Define Your Objectives
Before diving into development, it’s essential to define the objectives of your dashboard web app. Consider the following questions:
- What key metrics or data points will the dashboard display?
- Who is the target audience for the dashboard?
- What are the specific use cases and functionalities required?
By clarifying these objectives, you can ensure that your dashboard meets the needs of its users and delivers valuable insights.
2. Choose the Right Technology Stack
Selecting the appropriate technology stack is crucial for developing a robust and scalable dashboard web app. Here are some key components to consider:
- Frontend Frameworks: Popular frameworks like React, Angular, and Vue.js can help you build a dynamic and responsive user interface.
- Backend Technologies: Node.js, Django, and Ruby on Rails are commonly used backend technologies for handling data processing and server-side logic.
- Data Visualization Libraries: Libraries such as D3.js, Chart.js, and Highcharts offer powerful tools for creating interactive and visually appealing charts and graphs.
- Database Systems: Depending on your data needs, you might use SQL databases (e.g., MySQL, PostgreSQL) or NoSQL databases (e.g., MongoDB, Firebase) to store and manage data.
3. Design the User Interface
An intuitive and user-friendly interface is essential for a successful dashboard web app. Consider the following design principles:
- Clarity and Simplicity: Use clear and concise labels, avoid clutter, and prioritize essential information to ensure users can quickly understand the data.
- Consistency: Maintain a consistent layout, color scheme, and design elements throughout the dashboard to enhance usability and visual appeal.
- Responsiveness: Ensure that your dashboard is responsive and functions well on various devices and screen sizes.
4. Integrate Data Sources
A dashboard web app typically pulls data from multiple sources. You’ll need to:
- Connect to APIs: Many applications offer APIs that allow you to fetch data programmatically. Integrate these APIs to retrieve real-time data for your dashboard.
- Use Data Connectors: For integrating with databases or other data storage solutions, use data connectors or ETL (Extract, Transform, Load) tools to streamline the process.
5. Implement Data Visualization
Effective data visualization is key to delivering meaningful insights. Utilize visualization libraries to create charts, graphs, and other visual elements that represent your data. Consider the following types of visualizations:
- Bar Charts: Useful for comparing quantities across different categories.
- Line Charts: Ideal for showing trends over time.
- Pie Charts: Effective for displaying proportions and percentages.
- Heatmaps: Great for visualizing data density and patterns.
6. Ensure Data Security
Protecting user data and ensuring the security of your dashboard web app is paramount. Implement security measures such as:
- Authentication and Authorization: Use secure authentication methods (e.g., OAuth, JWT) and enforce role-based access control to restrict data access.
- Data Encryption: Encrypt sensitive data both in transit and at rest to prevent unauthorized access.
- Regular Updates: Keep your software and libraries up to date to mitigate vulnerabilities and security risks.
7. Test and Optimize
Before launching your dashboard web app, conduct thorough testing to ensure it functions as expected. Consider the following types of testing:
- Functional Testing: Verify that all features and functionalities work correctly.
- Performance Testing: Assess the app’s performance under different conditions and optimize for speed and efficiency.
- User Testing: Gather feedback from real users to identify usability issues and make necessary improvements.
8. Deploy and Maintain
Once testing is complete, deploy your dashboard web app to a production environment. Consider using cloud platforms like AWS, Azure, or Google Cloud for scalable and reliable hosting. After deployment, continue to monitor the app’s performance, address any issues, and update it regularly to meet evolving user needs.
Best Practices for Developing a Dashboard Web App
To ensure the success of your dashboard web app, follow these best practices:
- Prioritize User Experience: Focus on creating a seamless and intuitive user experience to enhance engagement and usability.
- Optimize Performance: Implement performance optimization techniques to ensure the app runs smoothly and efficiently.
- Provide Customization Options: Allow users to customize their dashboard views and settings to meet their specific needs and preferences.
- Offer Help and Support: Provide users with resources such as tutorials, FAQs, and support channels to assist them in navigating and using the dashboard.
Advanced Features to Consider
As you progress in developing your dashboard web app, consider incorporating advanced features that can significantly enhance functionality and user experience. Here are a few ideas:
1. Interactive Elements
Adding interactive elements can make your dashboard more engaging and user-friendly. Consider implementing features such as:
- Drill-Down Capabilities: Allow users to click on data points to view more detailed information.
- Filtering and Sorting: Enable users to filter and sort data based on their preferences or criteria.
- Dynamic Widgets: Provide customizable widgets that users can add, remove, or rearrange on their dashboard.
2. Real-Time Data Updates
For applications where timely data is crucial, implementing real-time data updates can enhance the dashboard’s effectiveness. Techniques for achieving real-time updates include:
- WebSockets: Use WebSocket connections to push real-time data updates from the server to the client.
- Polling: Implement periodic polling to fetch updated data at regular intervals.
3. User Personalization
Personalization can improve user satisfaction by tailoring the dashboard to individual preferences. Consider adding features such as:
- Custom Dashboards: Allow users to create and save their own custom dashboard layouts.
- User Profiles: Enable users to set preferences and configurations specific to their needs.
4. Data Export Options
Providing users with the ability to export data can be valuable for offline analysis and reporting. Implement options for exporting data in various formats, such as:
- CSV: Commonly used for data analysis in spreadsheet applications.
- PDF: Ideal for generating printable reports.
- Excel: Useful for users who prefer working with Excel spreadsheets.
5. Mobile Optimization
Ensure that your dashboard web app is optimized for mobile devices. A mobile-friendly design will improve accessibility and usability for users on the go. Consider the following:
- Responsive Design: Use responsive design techniques to ensure the dashboard looks and functions well on different screen sizes.
- Touch Interactions: Implement touch-friendly controls and interactions for mobile users.
Common Challenges and Solutions
Developing a dashboard web app can come with its own set of challenges. Here are some common issues and strategies to address them:
1. Handling Large Data Sets
When working with large data sets, performance can become an issue. To manage this:
- Data Aggregation: Aggregate data to reduce the volume presented in the dashboard, displaying summary statistics and allowing users to drill down for more details.
- Pagination and Infinite Scrolling: Implement pagination or infinite scrolling to handle large lists of data without overwhelming the user or the browser.
2. Ensuring Cross-Browser Compatibility
Different browsers may render your dashboard differently, leading to inconsistencies. To ensure cross-browser compatibility:
- Test Across Browsers: Test your dashboard on various browsers and versions to identify and fix compatibility issues.
- Use Browser Prefixes: Utilize CSS vendor prefixes to ensure styling works consistently across different browsers.
3. Managing User Data Security
Protecting user data is critical, especially if your dashboard handles sensitive information. To enhance security:
- Implement Role-Based Access Control: Ensure that users have access only to the data and features relevant to their role.
- Regular Security Audits: Conduct regular security audits to identify and address potential vulnerabilities.
Measuring Success and Gathering Feedback
After launching your dashboard web app, it’s important to measure its success and gather user feedback to make continuous improvements. Consider the following methods:
1. Analytics and Metrics
Track key performance indicators (KPIs) to assess the dashboard’s effectiveness, such as:
- User Engagement: Measure how often users interact with the dashboard and which features they use most.
- Load Times: Monitor the dashboard’s load times to ensure it performs well under different conditions.
- Error Rates: Track any errors or issues users encounter to address them promptly.
2. User Feedback
Gather feedback from users to understand their experience and identify areas for improvement. Methods include:
- Surveys and Questionnaires: Use surveys to collect detailed feedback from users about their experience and suggestions for improvement.
- User Interviews: Conduct interviews to gain deeper insights into user needs and preferences.
- Feedback Forms: Provide an easy way for users to submit feedback directly through the dashboard.
Future Trends in Dashboard Development
As technology continues to evolve, new trends and innovations are shaping the future of dashboard development. Stay ahead of the curve by considering these emerging trends:
1. Artificial Intelligence and Machine Learning
AI and machine learning can enhance dashboards by providing predictive analytics, automated insights, and personalized recommendations. Explore how these technologies can add value to your dashboard.
2. Augmented Reality (AR) and Virtual Reality (VR)
AR and VR technologies offer new ways to interact with data and visualize complex information. Consider how these technologies might be integrated into future dashboard designs.
3. Voice-Activated Dashboards
Voice recognition technology is becoming more prevalent, allowing users to interact with dashboards using voice commands. Explore the potential of voice-activated features for a more intuitive user experience.
Conclusion
Developing a dashboard web app involves a blend of strategic planning, technical expertise, and user-centric design. By following the steps outlined in this guide, incorporating advanced features, addressing common challenges, and staying informed about future trends, you can create a powerful and effective dashboard that delivers valuable insights and enhances decision-making.
At NOS Digital, we are committed to helping you achieve your web development goals. Whether you’re embarking on a new project or seeking to improve an existing dashboard, our team of experts is here to support you every step of the way. For more information and assistance, visit NOS Digital and take your dashboard web app development to the next level.


